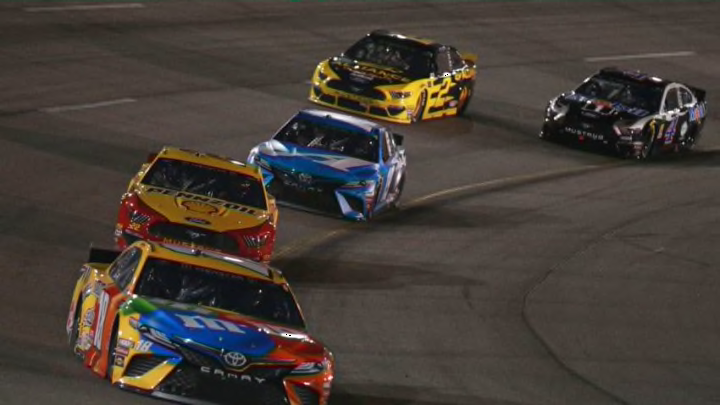
The 2019 NASCAR Cup Series rules package has faced a lot of criticism. But do the statistics back up claims that you “can’t pass”?
Two new baseline rules packages were introduced ahead of the 2019 NASCAR Cup Series season, and they have been tailored to different tracks on the 36-race schedule.
In general, these rules packages are designed to increase downforce and reduce horsepower, thereby making the racing and the competition closer throughout the field.
Passing and close racing can sometimes be one in the same, but that isn’t necessarily the case. In fact, there has been a lot of criticism directed at this package overhaul, led by the outspoken Kyle Busch, who has, on multiple occasions, stated that “you can’t pass”.
More from NASCAR Cup Series
- NASCAR Cup Series: New team set to compete in 2024
- NASCAR: Surprising name continuously linked to new seat
- NASCAR driver at risk of missing the Daytona 500?
- NASCAR set for rare appearance last seen 13 years ago
- NASCAR team adds third car, names driver for 2024 Daytona 500
But do the statistics back that up?
Let’s compare some of the key statistics from last year to some of the key statistics through the first 27 races of this year.
At this time last year, there had been 66,942 green flag passes. So far this year, there have been 84,524, which is nearing last year’s total of 88,679.
Of the first 27 races on the schedule, 16 have featured more green flag passes this year than they did last year and 17 have averaged more passes per green flag lap than they did last year.
Last year at this time, there had been 419 lead changes. So far this year, there have been 473, which is quickly closing in on last year’s total of 550. Of the first 27 races on the schedule, 16 have featured more lead changes this year than they did last year.
The average starting position of the race winner from year to year is nearly identical through 27 races, with that number being 9.11 last season and 9.03 this season. It ended up being 8.78 once the 2018 season concluded.
Through the first 27 races of the 2018 season, 26 had ended under green flag conditions. The average winning margin in these 26 races was 2.609 seconds, and 10 races featured winning margins of under one second. So far this season, 25 races have ended under green flag conditions. The average winning margin in these 25 races was 1.610, and 15 races featured winning margins of under one second.
As stated above, while passing and close racing can sometimes be one in the same, that isn’t necessarily the case.
However, the passing statistics coupled with the winning margin statistics illustrate clearly that this year’s packages are doing their job and that the idea that you “can’t pass” is somewhat of an incorrect sentiment.
Are there exceptions? Sure. There never won’t be exceptions. No packages will be perfect at every single track on the schedule given how different many of them are to one another.
But more often than not, this year’s packages have proven to be an improvement. There are no two ways around that.
What will tonight’s NASCAR Cup Series race at Richmond Raceway, the Federated Auto Parts 400, look like as it pertains to passing? The race at the track in April featured 1,238 green flag passes for an average of 3.4 passes per green flag lap, and it featured eight lead changes and a winning margin of just 0.178 seconds. Joe Gibbs Racing’s Martin Truex Jr. held off Team Penske’s Joey Logano to win this race and secure his first victory as a Joe Gibbs Racing driver.
Tonight’s race is set to be broadcast live from the track in Richmond, Virginia beginning at 7:30 p.m. ET on NBC Sports Network.
